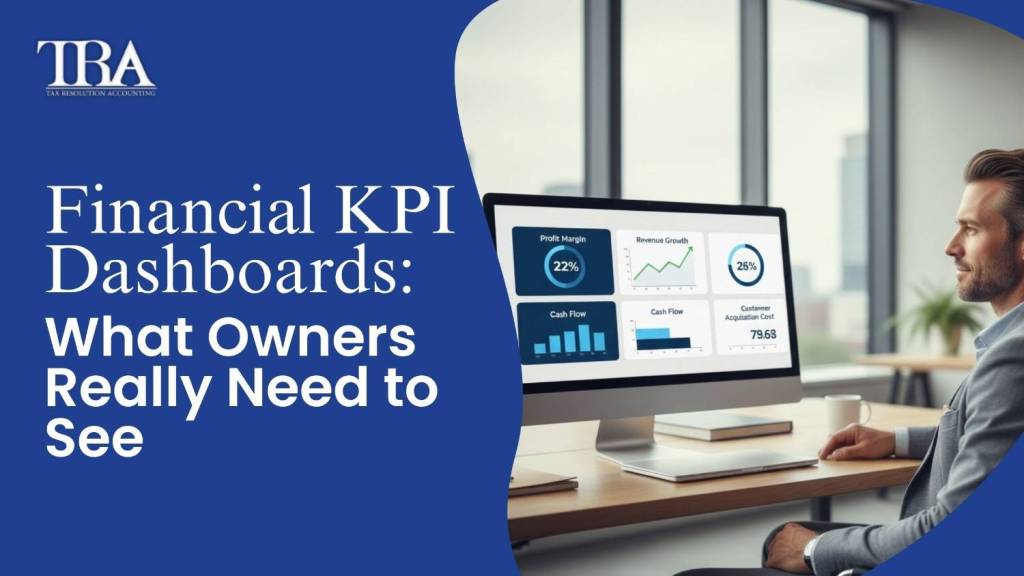
Most business owners feel buried under piles of complex reports. You might receive a thick packet of papers every month. But do you truly know if your company is healthy? A financial KPI dashboard solves this major problem. It takes messy accounting data and turns it into a clear story.
The goal is to show you the vital signs of your business at a glance. You should not need a math degree to understand your own profit. This guide explains how to focus on the numbers that actually matter. We will show you how to build a view that drives smart decisions and faster growth.
Stop drowning in reports! See your business clearly with a financial KPI dashboard. Call +1 434-338-7149 for your free strategy call today.
Why Your Current Reports Might Be Failing You
Many owners rely only on old tax returns or basic bank balances. These numbers tell you what happened in the past. They do not help you plan for next week or next year. If you only look at the past, you are driving while looking at the rearview mirror. This lack of vision creates constant stress and uncertainty about your payroll or tax bills.
The Problem with Data Overload
Too much information is just as bad as no information. When a report has fifty rows of numbers, you stop reading it. Owners often ignore complex spreadsheets because they feel overwhelmed. A great financial KPI dashboard filters out the noise. It highlights only the top metrics that move your business forward.
Moving from Guessing to Knowing
Without a visual tool, you are just guessing about your success. You might see a high bank balance and feel safe. However, you might have unpaid bills or tax debts waiting to hit. At taxresolutionaccounting.com, we help you see these hidden traps early. A clear dashboard turns your “gut feelings” into solid facts you can trust.
The Essential Metrics for an Effective Dashboard
Every business is unique, but the core financial truths remain the same. To lead well, you must track specific categories of data. These metrics give you a full 360-degree view of your company. By viewing these clearly, you gain the advantage of speed and the benefit of total peace of mind.
1. High-Level CFO Reporting Metrics
You need to see the big picture every single month. CFO reporting metrics include your net profit margin and your debt-to-equity ratio. These numbers show the overall strength of your entire organization. They help you stay bankable and ready for future loans or investments.
2. Deep Dives into Unit Economics
Do you know the exact profit you make on a single sale? A unit economics dashboard tracks the cost to get one customer. It also tracks the total money that the customer spends over time. If your cost to get a customer is too high, your business will struggle to scale.
3. Comparing Your Results to KPI Benchmarks
Numbers mean nothing without context. You need to see how you stack up against other companies in your field. Using KPI benchmarks lets you know if your rent or labor costs are too high. It shows you exactly where you can improve to beat your rivals.
How a Dashboard Helps Different Business Stages
Your dashboard should change as your company grows. A startup has different needs than a firm that has been open for twenty years.
- For New Startups: Focus on cash burn and customer growth. You need to know exactly when you will run out of money.
- For Growing Firms: Focus on the unit economics dashboard. This ensures your growth is actually profitable.
- For Mature Companies: Focus on efficiency and KPI benchmarks. This helps you keep your margins high as you age.
Setting Up Your Success Plan
Implementation is about more than just software. It is about creating a new habit of leadership. Use these tips to ensure your new tool actually gets used. You have the desire to grow; now you need the right action plan to make it happen.
Choose a KPI Dashboard Small Business Tool
You do not need an expensive enterprise system. Many tools are made specifically for smaller firms. A KPI dashboard small business setup should connect directly to your accounting software. This ensures your data is always fresh and accurate without manual entry.
Establish a Weekly Review Routine
Check your dashboard at the same time every week. Look for trends that are moving in the wrong direction. If your labor costs are rising, talk to your team immediately. This proactive approach stops small problems from becoming huge disasters.
| Metric Type | What It Tracks | Why It Matters |
| Cash | Days Cash on Hand | Shows your total survival time. |
| Profit | Gross Margin % | Shows if your pricing is correct. |
| Sales | CAC Payback | Shows how fast you get your money back. |
| Debt | Current Ratio | Shows if you can pay your short-term bills. |
The Value of Professional Financial Oversight
Building a dashboard on your own can be tricky. You might track the wrong things or use broken formulas. Working with an expert ensures your data is clean and your strategy is sound.
We simplify the entire process for you. We help you pick the right CFO reporting metrics for your specific goals. Our team sets up the technology and teaches you how to read the charts. We want you to feel confident every time you look at your numbers. When you have total clarity, you can lead your company to a much brighter future.
Conclusion
Stop letting your financial data sit in a dark corner. Use a financial KPI dashboard to bring your numbers into the light. This simple change allows you to lead with facts instead of fear. You will know exactly where your profit goes and how to grow it.
At Tax Resolution Accounting, we are ready to help you build the perfect view of your business. We believe every owner deserves to see the truth about their company’s health. Take the first step toward total clarity today, call +1 434-338-7149 and watch your business reach new heights.
FAQs
Q.1. How often should I check my financial KPI dashboard?
You should look at your high-level numbers at least once a week. A deeper dive into all metrics should happen once a month. This keeps you aware of trends without causing daily stress.
Q.2. Can I build a dashboard in a simple spreadsheet?
Yes, you can use a spreadsheet, but it requires manual work. A modern KPI dashboard small business tool automates the data. This saves you time and prevents human errors in your math.
Q.3. What is the difference between a P&L and a dashboard?
A P&L is a list of revenue and expenses for a set time. A dashboard uses charts to show trends, goals, and ratios. Dashboards are much easier for owners to read quickly.
Q.4. Why are unit economics dashboard views so important?
They show if your basic business model actually works. If you lose money on every unit sold, more sales will only make you lose money faster. You must fix the unit cost first.
Q.5. Where can I find reliable KPI benchmarks?
You can find them through industry associations or specialized financial firms. These benchmarks help you see if your spending is “normal” for your specific type of business.